No products in the cart.
Market Reversal Alerts indicator MT4 Unlimited
$49.00 $9.90
🛒 Supports cryptocurrency/PayPal payments.
🔥 Get 30% OFF on orders over $100 ! 🔥
🛒 Use Discount Code: 10% OFF
🛒 Discount Code: Join the Telegram group to view the pinned message
🛍 Hurry, grab your favorites now!
💬Email:[email protected]
💬Telelgram:@masterytrader2013
🔗Telegram group: https://t.me/mtradehub
Note: If you have any problems with the download, please contact us via Telegram or by email, and good luck with your financial transactions.
Telegram:https://t.me/masterytrader2013
Email:[email protected]
Our website assures that if you have purchased any resources from us within the past 6 months and are unable to use them due to updates in the MT4/MT5 versions, you can contact us at any time and provide your purchase proof. We will offer you equivalent resources free of charge on our website.
https://www.mql5.com/en/market/product/57892
Expert: Market Reversal Alerts 1420+.ex4 (Unlocked-NoDLL)
Documentation: NO
Market Reversal Alerts Indicator was launched on the MQL5 Market on May 7th, 2020, and was updated to version 5.10 on November 12th, 2021. Although it has not been updated for a year, it has sold 26 copies per month so far, which indicates that this indicator has stood the test of time.
There are three main reasons why I appreciate this indicator:
Firstly, it demonstrates the concept of supply and demand trading and market structure in an extremely simplified way;
Secondly, the entry position of this indicator can easily set a stop-loss position in most cases. With a reasonable stop-loss position, it is relatively easy to set a take-profit position through the risk-reward ratio;
Thirdly, on the MQL5 official website, the video provides clear trading strategies, and these strategies are highly operable.
The red horizontal line is a reasonable stop-loss position.
Although this indicator is simple and practical, it is not as simple as loading it directly onto the chart. At least you should know what cross-timeframe analysis means. It is essential to learn how to use the indicator by following the video-based instructions. That being said, I wish all traders good luck in their trading.
MQL5 Market Introduction
Profit from market structure changes as price reverses and pulls back.
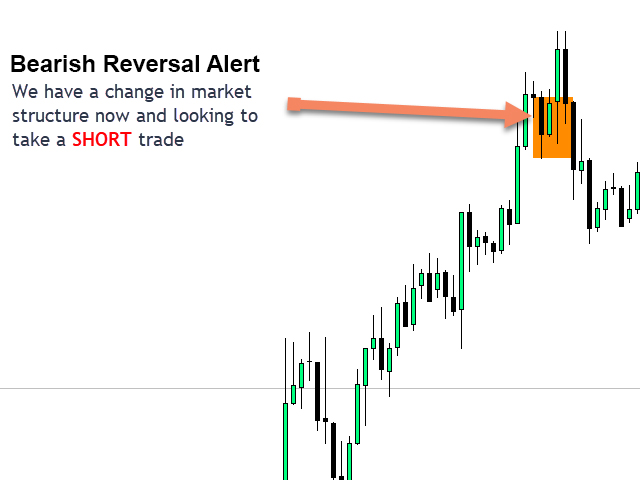
The market structure reversal alert indicator identifies when a trend or price move is approaching exhaustion and ready to reverse. It alerts you to changes in market structure which typically occur when a reversal or major pullback are about to happen.
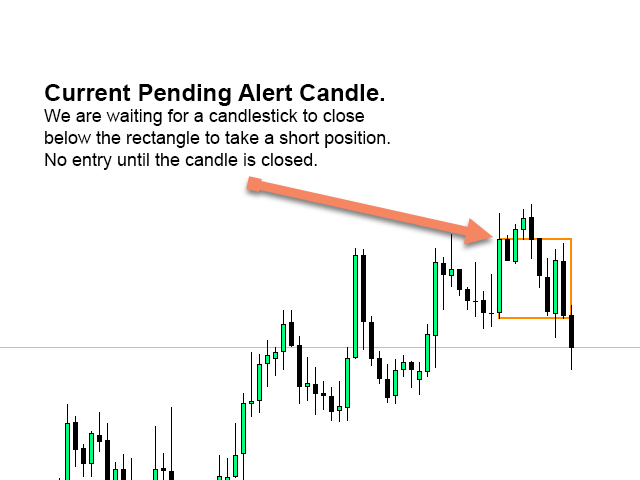
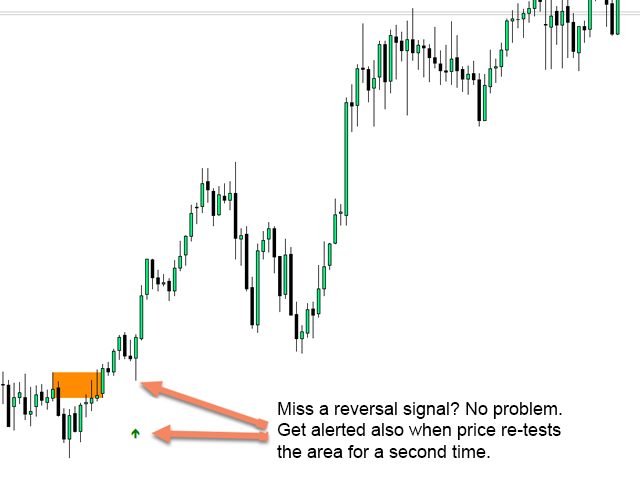
The indicator identifies breakouts and price momentum initially, every time a new high or low is formed near a possible exhaustion point. The indicator draws in a rectangle on the last opposite coloured candle. It will then trail the rectangle along with price as it continues to move in it’s current short term trend. Once price weakens enough that it closes back above or below the rectangle this would indicate a potential shift in market structure is taking place. The indicator then alerts you to a potential shift in direction and the start of a possible reversal in trend or major pullback.
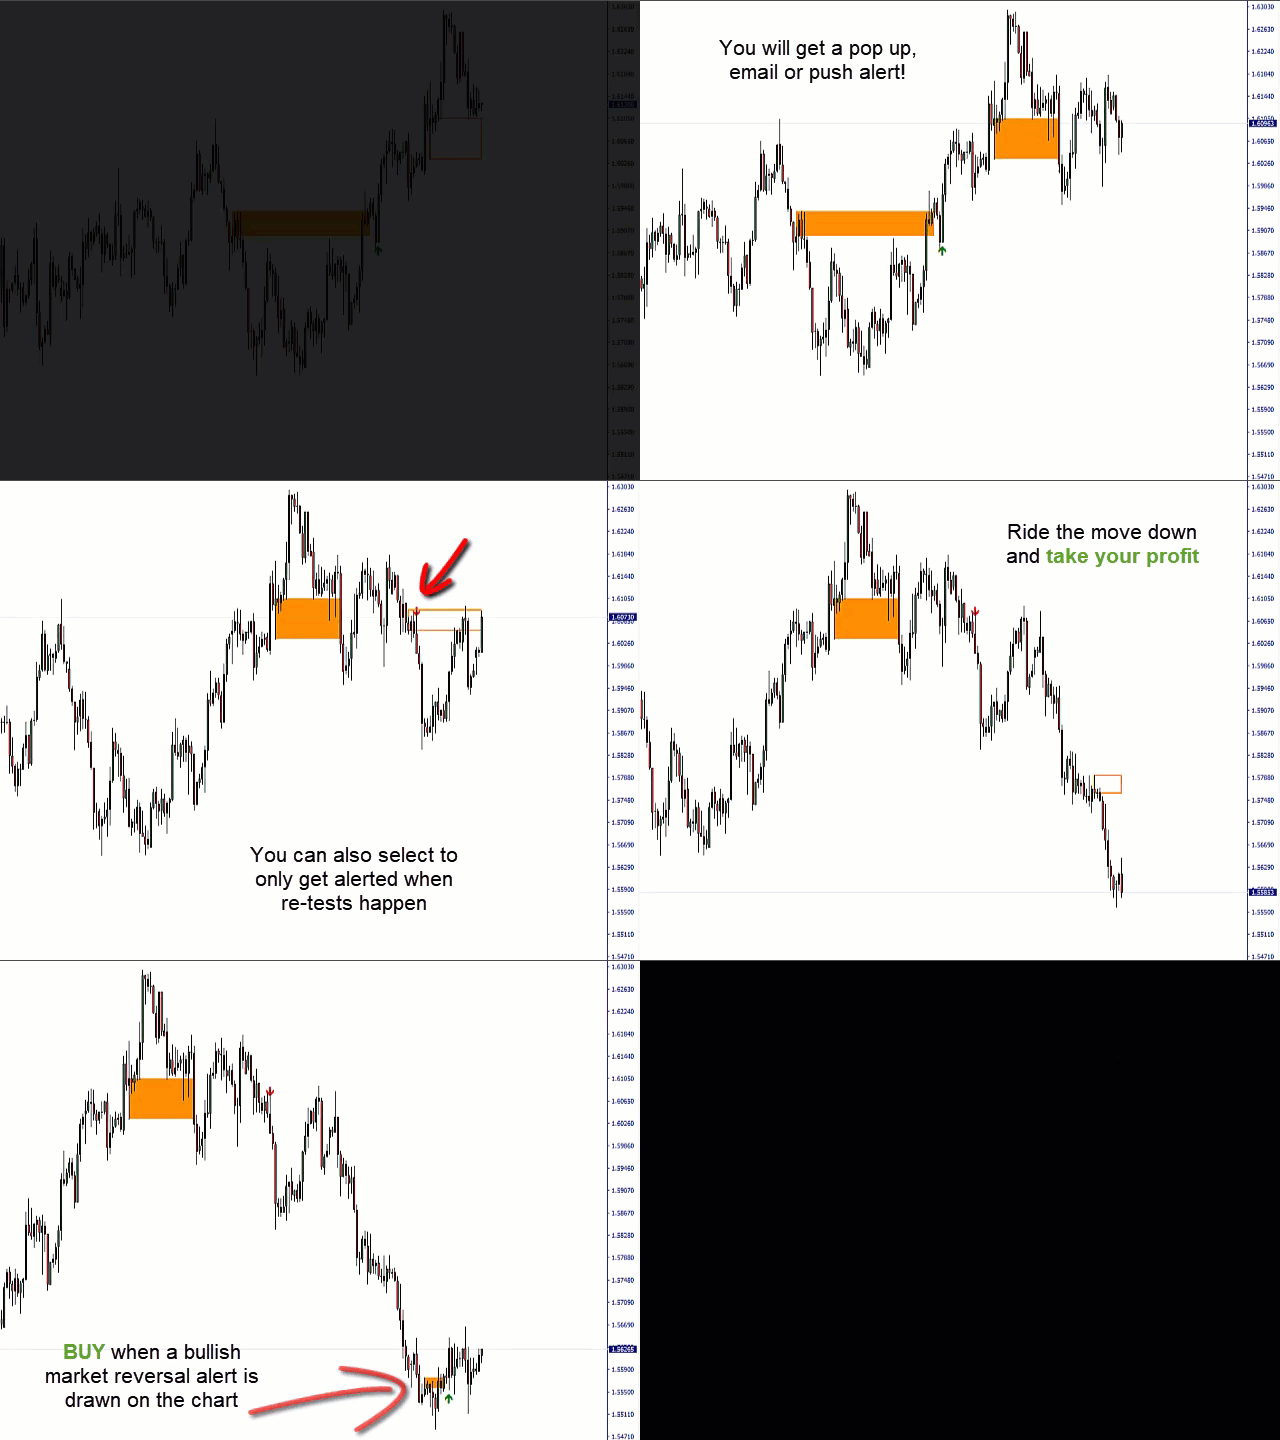
See the indicator in action below to see how it works!
Optional dashboard add-on to monitor ALL pairs and timeframes here: https://www.mql5.com/en/market/product/62751
EA available here: Auto trade market reversal alerts! https://www.mql5.com/en/market/product/65383
MT5 version available here: https://www.mql5.com/en/market/product/57892
Features
- Alerts you to potential changes in market structure at key exhaustion points
- Automatically draws in short term market structure as price approaches exhaustion levels
- Trails the alert rectangles behind price as it moves in it’s current trend direction to find the tightest entries
- Changes colour to a solid block rectangle on alerts to show where potential reversals in market structure have occurred
- Works on all symbols and timeframes
- Integrated pop-up, push and email alerts built in
- Alerts when a re-test of a reversal alert has happened confirming the entry as being more likely
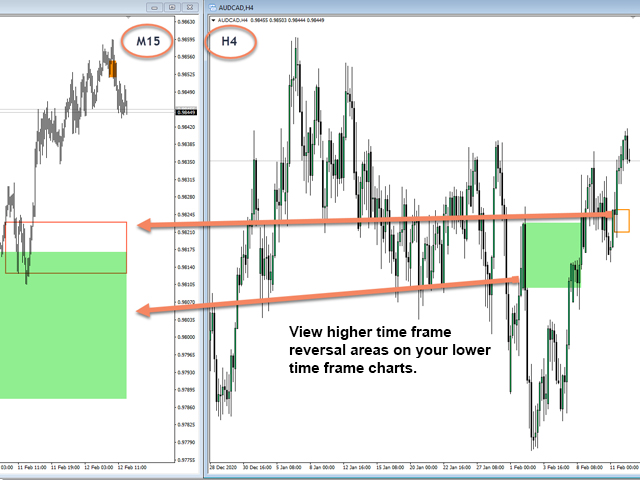
- Allows you to view higher time frame reversal rectangles on your lower trading time frame. Great for trend traders and identifying higher time frame trend direction
- Select all reversal alerts or just long or short alerts, select the directional alerts you want based on each pairs current trend direction
- View higher time frame directional bias arrow on your lower time frame chart.

Strategy & How To Trade With The Market Structure Reversal Indicator
When a reversal alert occurs:
- Look left! Is there a supply/demand or support/resistance level that we’re turning at. Market structure shifts (reversals) usually occur when price is retesting an old level or a stop hunt has just happened above that support or resistance level.
- Consult a higher time frame to see if there is an area of support/resistance we are turning at. As above changes in market structure will often happen on lower time frames when at major levels on a higher time frame.
If the above conditions are met simply place a trade in the direction of the reversal.
You can add additional indicators as validation or use this indicator to add further validation to your existing indicators or strategy!
Stop Loss and Take Profit
Your stop should always go just above the most recent high or below the most recent low. If the reversal is correctly identifying a shift in market structure price will rarely move back above/below the most recent peak. The size of your stop will be dependent on how aggressive the last move to create the recent high was.
Take profit is up to the individual but using a 1.5:1 or 2:1 risk to reward is easily achievable. Entering 2 trades and having one trail along with price just above/below new rectangles as they are drawn on the chart can achieve 5:1 and higher risk reward.
Download the free demo to use in the strategy tester and see how it works.
See how big some of the moves are after the reversal alerts trigger!
Related products
Sale!
Expert Advisor(MT4)
Sale!
Expert Advisor(MT4)
Sale!
Indicators(MT4)
Sale!
Indicators(MT4)
Sale!
Indicators(MT4)
Sale!
Expert Advisor(MT4)
Sale!
Indicators(MT4)
Sale!
Indicators(MT4)


